
How to read your EQA report: z-scores explained
What the z-score on your HuQAS EQA report means, how it becomes a grade, and what to do when a result comes back as a warning or not acceptable.

Every HuQAS test event ends with a report for each program you take part in, and the number most people look at first is the z-score. Here's what it means, how it becomes a grade, and what to do when a result comes back with a warning.
What a z-score measures
For quantitative analytes, we evaluate results in line with ISO 13528:2015. There isn't one "correct" answer your result gets checked against. Instead, your result is compared with the results from the other laboratories in the same test event. From those results we work out a robust average (the assigned value) and a standard deviation for proficiency assessment.
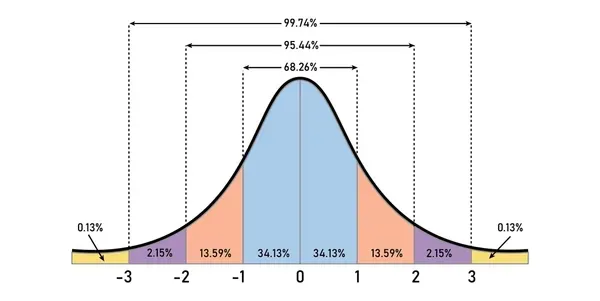
The z-score tells you how many of those standard deviations your result sits from the assigned value:
z = (your result − assigned value) ÷ standard deviation for proficiency assessment
A z-score of 0 means you landed exactly where your peers did. The further it is from 0, in either direction, the further your result is from theirs.
How the score becomes a grade
- Between −2.0 and +2.0 is acceptable.
- Further than 2.0 from zero, but closer than 3.0, is a warning.
- 3.0 or more from zero is not acceptable. At that distance your result is treated as an outlier.
Each program also gets an overall score, which is the average across all the samples you tested.
Who you're compared with
Laboratories run different instruments and methods, and some difference between them is normal. So each result is compared with three peer groups: laboratories on the same instrument model, laboratories using the same method, and every laboratory that reported the analyte.
For each group the report shows the robust mean, the standard deviation, the coefficient of variation and how many laboratories took part. If you're close to your instrument peers but far from everyone else, the difference probably comes from the method or the instrument, not from anything your laboratory did.
The two charts
The z-score plot shows your scores across test events. It's worth checking first, because it shows a drift before it turns into a failure. The overlapping histograms show where your result sat among all three peer groups.
What to do with a warning or an unacceptable result
ISO 15189:2022 expects accredited laboratories to review EQA results against set criteria, investigate the ones that fall outside them, and take corrective action, including deciding whether patient results were affected. This is the order we suggest working through:
- Rule out clerical errors: a typo, the wrong units, or the wrong instrument or method picked when entering results.
- Check how the sample was handled: storage, reconstitution, and how long it waited before testing.
- Look at your internal quality control and calibration records for the day you ran it.
- Compare your result with your instrument and method peers, to see whether the problem is specific to your laboratory.
- Decide whether patient results from the same period could be affected, and act on that.
- Write down the root cause and what you changed, then watch the next test events to confirm the fix held.
A single warning is a reason to look closer. A run of warnings on the same analyte, or scores moving steadily in one direction on the plot, deserves the same attention as a result graded not acceptable.
The full report interpretation guide is on our downloads page. HuQAS also runs training on root cause analysis and corrective and preventive action (CAPA). If you want help working through a result, talk to us.